COMET
  • Get Started
    • Quickstart Guide
    • Install and Use COMET
    • Get Started
  • Learn By Skill Level
    • Getting Started
    • Beginner
    • Intermediate - Econometrics
    • Intermediate - Geospatial
    • Advanced

    • Browse All
  • Learn By Class
    • Making Sense of Economic Data (ECON 226/227)
    • Econometrics I (ECON 325)
    • Econometrics II (ECON 326)
    • Statistics in Geography (GEOG 374)
  • Learn to Research
    • Learn How to Do a Project
  • Teach With COMET
    • Learn how to teach with Jupyter and COMET
    • Using COMET in the Classroom
    • See COMET presentations
  • Contribute
    • Install for Development
    • Write Self Tests
  • Launch COMET
    • Launch on JupyterOpen (with Data)
    • Launch on JupyterOpen (lite)
    • Launch on Syzygy
    • Launch on Colab
    • Launch Locally

    • Project Datasets
    • Github Repository
  • |
  • About
    • COMET Team
    • Copyright Information
  1. R Notebooks
  2. Working with R Scripts (2)
  • Learn to Research


  • STATA Notebooks
    • Setting Up (1)
    • Working with Do-files (2)
    • STATA Essentials (3)
    • Locals and Globals (4)
    • Opening Datasets (5)
    • Creating Variables (6)
    • Within Group Analysis (7)
    • Combining Datasets (8)
    • Creating Meaningful Visuals (9)
    • Combining Graphs (10)
    • Conducting Regression Analysis (11)
    • Exporting Regression Output (12)
    • Dummy Variables and Interactions (13)
    • Good Regression Practices (14)
    • Panel Data Regression (15)
    • Difference in Differences (16)
    • Instrumental Variable Analysis (17)
    • STATA Workflow Guide (18)

  • R Notebooks
    • Setting Up (1)
    • Working with R Scripts (2)
    • R Essentials (3)
    • Opening Datasets (4)
    • Creating Variables (5)
    • Within Group Analysis (6)
    • Combining Datasets (7)
    • Creating Meaningful Visuals (8)
    • Combining Graphs (9)
    • Conducting Regression Analysis (10)
    • Exporting Regression Output (11)
    • Dummy Variables and Interactions (12)
    • Good Regression Practices (13)
    • Panel Data Regression (14)
    • Difference in Differences (15)
    • Instrumental Variable Analysis (16)
    • R Workflow Guide (17)

  • Pystata Notebooks
    • Setting Up (1)
    • Working with Do-files (2)
    • STATA Essentials (3)
    • Locals and Globals (4)
    • Opening Datasets (5)
    • Creating Variables (6)
    • Within Group Analysis (7)
    • Combining Datasets (8)
    • Creating Meaningful Visuals (9)
    • Combining Graphs (10)
    • Conducting Regression Analysis (11)
    • Exporting Regression Output (12)
    • Dummy Variables and Interactions (13)
    • Good Regression Practices (14)
    • Panel Data Regression (15)
    • Difference in Differences (16)
    • Instrumental Variable Analysis (17)
    • STATA Workflow Guide (18)

On this page

  • Prerequisites
  • Learning Outcomes
  • 2.1 Opening R Scripts from R Interface
  • 2.2 Writing Comments in our Code
  • 2.3 Clearing the R Session
  • 2.4 Wrap Up
  • Report an issue

Other Formats

  • Jupyter
  1. R Notebooks
  2. Working with R Scripts (2)

02 - Working with R Scripts

econ 490
r
scripts
commenting
delimiters
clearing
This notebook covers how to write and work with R scripts. We go over how to create a script, commenting, and preparing our R session.
Author

Marina Adshade, Paul Corcuera, Giulia Lo Forte, Jane Platt

Published

29 May 2024

Prerequisites

  1. Connect to a Jupyter Lab session using R.

Learning Outcomes

  1. Be able to effectively use R script files.

2.1 Opening R Scripts from R Interface

If we choose to work with R, it is very advisable to install RStudio here. RStudio provides a nice interface to work with R code. Whenever we work with R or any other programming language, it is very important that we make our code replicable. For instance, we may be working on a graph and realize that it is not looking the way we wanted it to look. Without a list of the commands we previously used, it may take a long time to re-do said graph with the proper corrections.

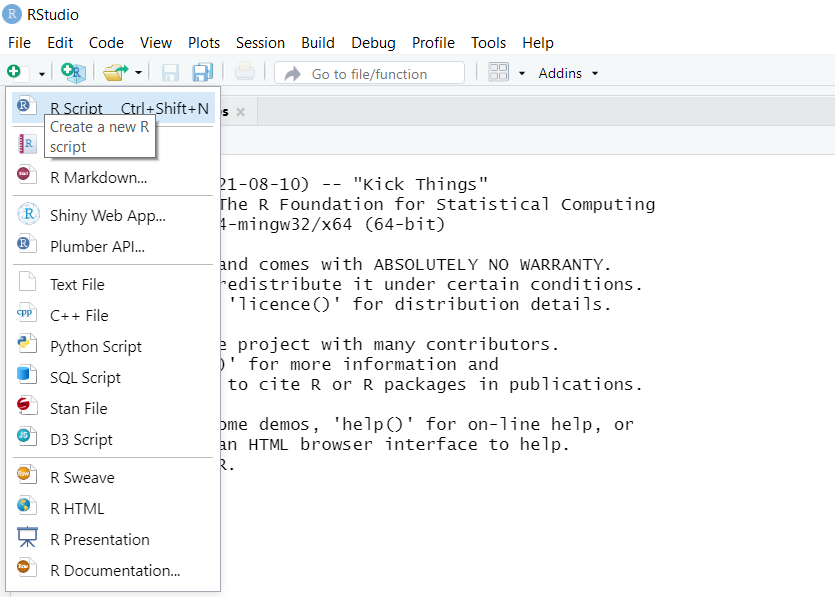
R provides a way to save code notebooks, also known as R scripts, where we can keep all the code we ran in a particular instance. To open the R Script Editor from our R session, we use the shortcut Ctrl(Command)+9 or click this part of the R Interface:

This image shows the menu bar of R Studio, pointing to where to click to open a new R Script

We can now observe a new window in your computer that looks like this:

This image shows an R Script that says “#Write code here!”.

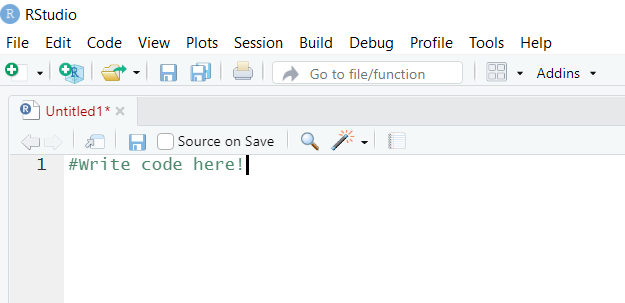
To run a highlighted part of code, we can use Ctrl(Command)+Enter.

Note: The Jupyter cells in the following lectures will work as an R script proxy, but whenever we run R non-interactively it is very important to keep track of any changes made in an R script.

2.2 Writing Comments in our Code

Writing comments for different parts of our code is a very good practice. It allows us to revisit code we wrote in the past and understand what we were doing.

Comments use the hashtag # like below.

# This is an R comment: nothing is gonna happen

Notice that we can also put it next to any line of code and it will still recognize such part as a comment. See below!

5 # This command is printing the number 5

Unlike other programs such as Stata, R does not allow multi-line comments. We need to put a hashtag at the beginning of each comment line.

#Multi-line comments only work...
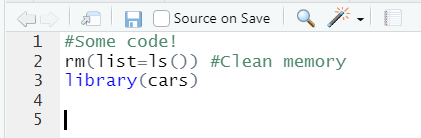
#this way!

On the website, the comments are highlighted in grey and commands are highlighted in blue. However, we can see from the following image that the comments are highlighted with the colour green within our R scripts. Whenever we see that colour, we can automatically recognize that as being a comment made by the author. Similarly, we can see that the recognized R commands in our script are highlighted in blue. These colours help us differentiate comments from code.

This image contains some examples of R code highlighting what comments and functions look like.

2.3 Clearing the R Session

Whenever we begin working with a new R session, it is advisable to clear the memory of any pre-existing objects. In Stata, this is done by the clear command. In R, we need to provide the list of objects to be removed from memory. The best way to do this is to provide a list of everything that exists in memory:

   rm(list=ls())

We want to include this line at the beginning of any new R script we create.

2.4 Wrap Up

When producing a research project, organization and attention to detail are extremely important skills to develop. That is why we should always save the R scripts in an easy-to-reach folder as soon as we begin our work by clicking the save icon on the top right. It is good practice to also save our R script each and every time we run it. Getting in the habit of doing this will save many hours of redoing accidentally lost work when a file closes!

We will be learning more about how to organize all of our files in Module 17.

Note: Showing an R script to a TA, instructor, or supervisor is a great way to get help or feedback. It is also good to submit a script for any practical assignments using Stata.
Setting Up (1)
R Essentials (3)
  • Creative Commons License. See details.
 
  • Report an issue
  • The COMET Project and the UBC Vancouver School of Economics are located on the traditional, ancestral and unceded territory of the xʷməθkʷəy̓əm (Musqueam) and Sḵwx̱wú7mesh (Squamish) peoples.